
Two New Recipes for Reports
As shown on the new features webinar, we are excited to share two new recipes that you can easily add to your database.
Login Metrics
This new python script easily allows you to see how many people have logged into your database or mobile app within a certain period of time (default is 30 days but this can easily be changed). You can also view these numbers by campus.
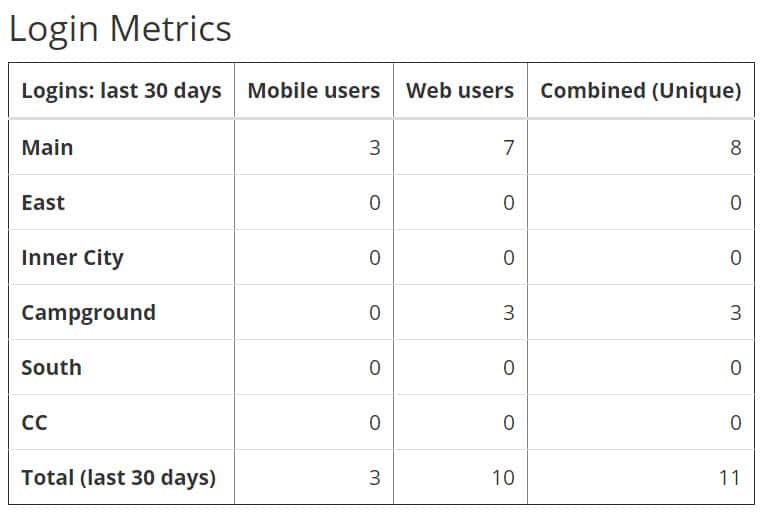
If one of your church goals is to drive adoption of the mobile app or get people to log into their account periodically, then this report will help you measure how well you are doing. The more people log into their accounts to update their data, register for events, access resources, manage their groups and volunteer information the better data you will have which in turn will make it easier to know and serve your people better.
For a copy of the script and instructions for how to customize it for your church please check out our documentation. If your church has multiple campuses, click here. If your church does not use the Campus feature in TouchPoint, click here.
Recurring Giving Forecast
This new python script allows you to forecast how much giving you can expect for a particular fund to come in through recurring giving over the next month and year based on what recurring gifts your congregants currently have set up in your system. It also tells you what percentage of your budget this is expected to cover.
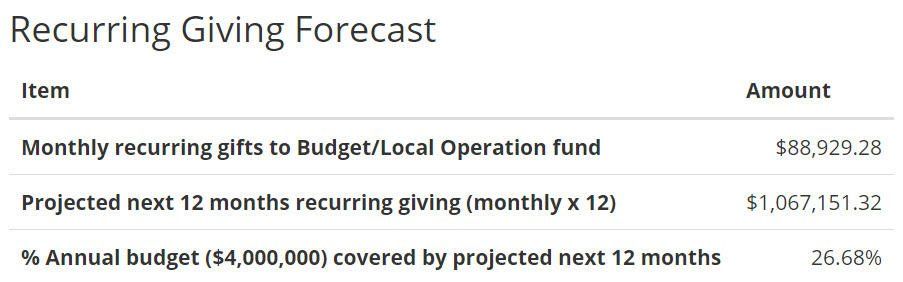
If one of your church goals is to increase the amount of money coming in through recurring giving, then this report will allow you to set a benchmark in order to measure how well you are doing towards that goal.
For a copy of the script and instructions for how to customize it for your church please check out our documentation here.